SUSE Observability as a Grafana Datasource
SUSE Observability can be used as a datasource for Grafana. This will allow to use Grafana as a visualization tool for your SUSE Observability data. This is useful if you already have some dashboards which you want to keep using. Because SUSE Observability exposes a Prometheus-compatible API, you can use the Prometheus datasource in Grafana to connect to SUSE Observability. This also makes SUSE Observability usable with other Prometheus-compatible solutions.
Prerequisites
Before you can add SUSE Observability as a datasource in Grafana, you need to setup a ServiceToken to authenticate with SUSE Observability. SUSE Observability recommends to create a dedicated role with permissions for this purpose.
You can do this via the SUSE Observability CLI:
> sts rbac create-subject --subject grafana
✅ Created subject 'grafana'
> sts rbac grant --subject grafana --permission get-metrics
✅ Granted permission 'get-metrics' on 'system' to subject 'grafana'
PERMISSION  | RESOURCE
get-metrics | system
This will create a new role in SUSE Observability called grafana and grant it the get-metrics permission. You can then create a ServiceToken for this role:
> sts service-token create --name grafana --roles grafana
✅ Service token created: svctok-XXXXXXXXXXXXXXXXXXXXXXXXXXXXXXXX
Learn more about managing ServiceTokens.
The returned ServiceToken can be used to authenticate with SUSE Observability. You can now add SUSE Observability as a datasource in Grafana.
Create a new SUSE Observability datasource in Grafana
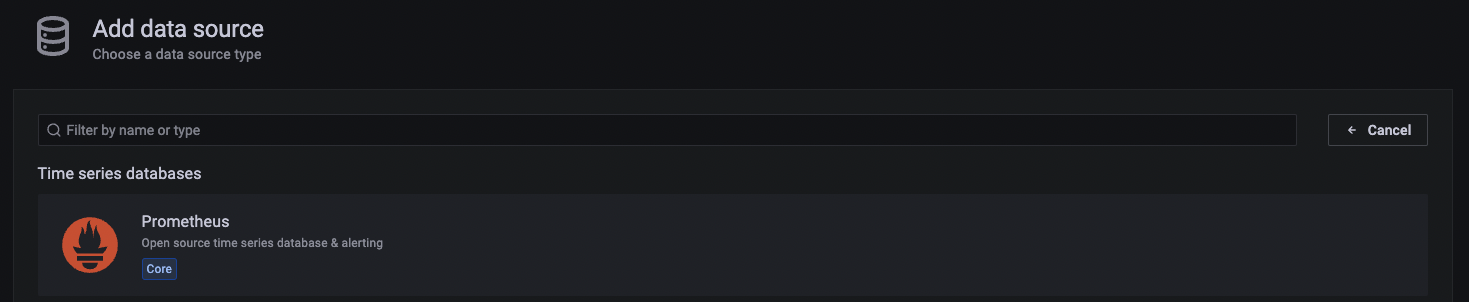
With the created ServiceToken, you can now add SUSE Observability as a datasource in Grafana. To do this, go to the Grafana UI and navigate to the datasource configuration page. Click on the Add data source button and select Prometheus from the list of datasources.
On the datasource configuration page, enter the following configuration details:
-
Name: SUSE Observability
-
Custom HTTP Headers
-
Header:
X-API-Key -
Value:
<service-token>
-
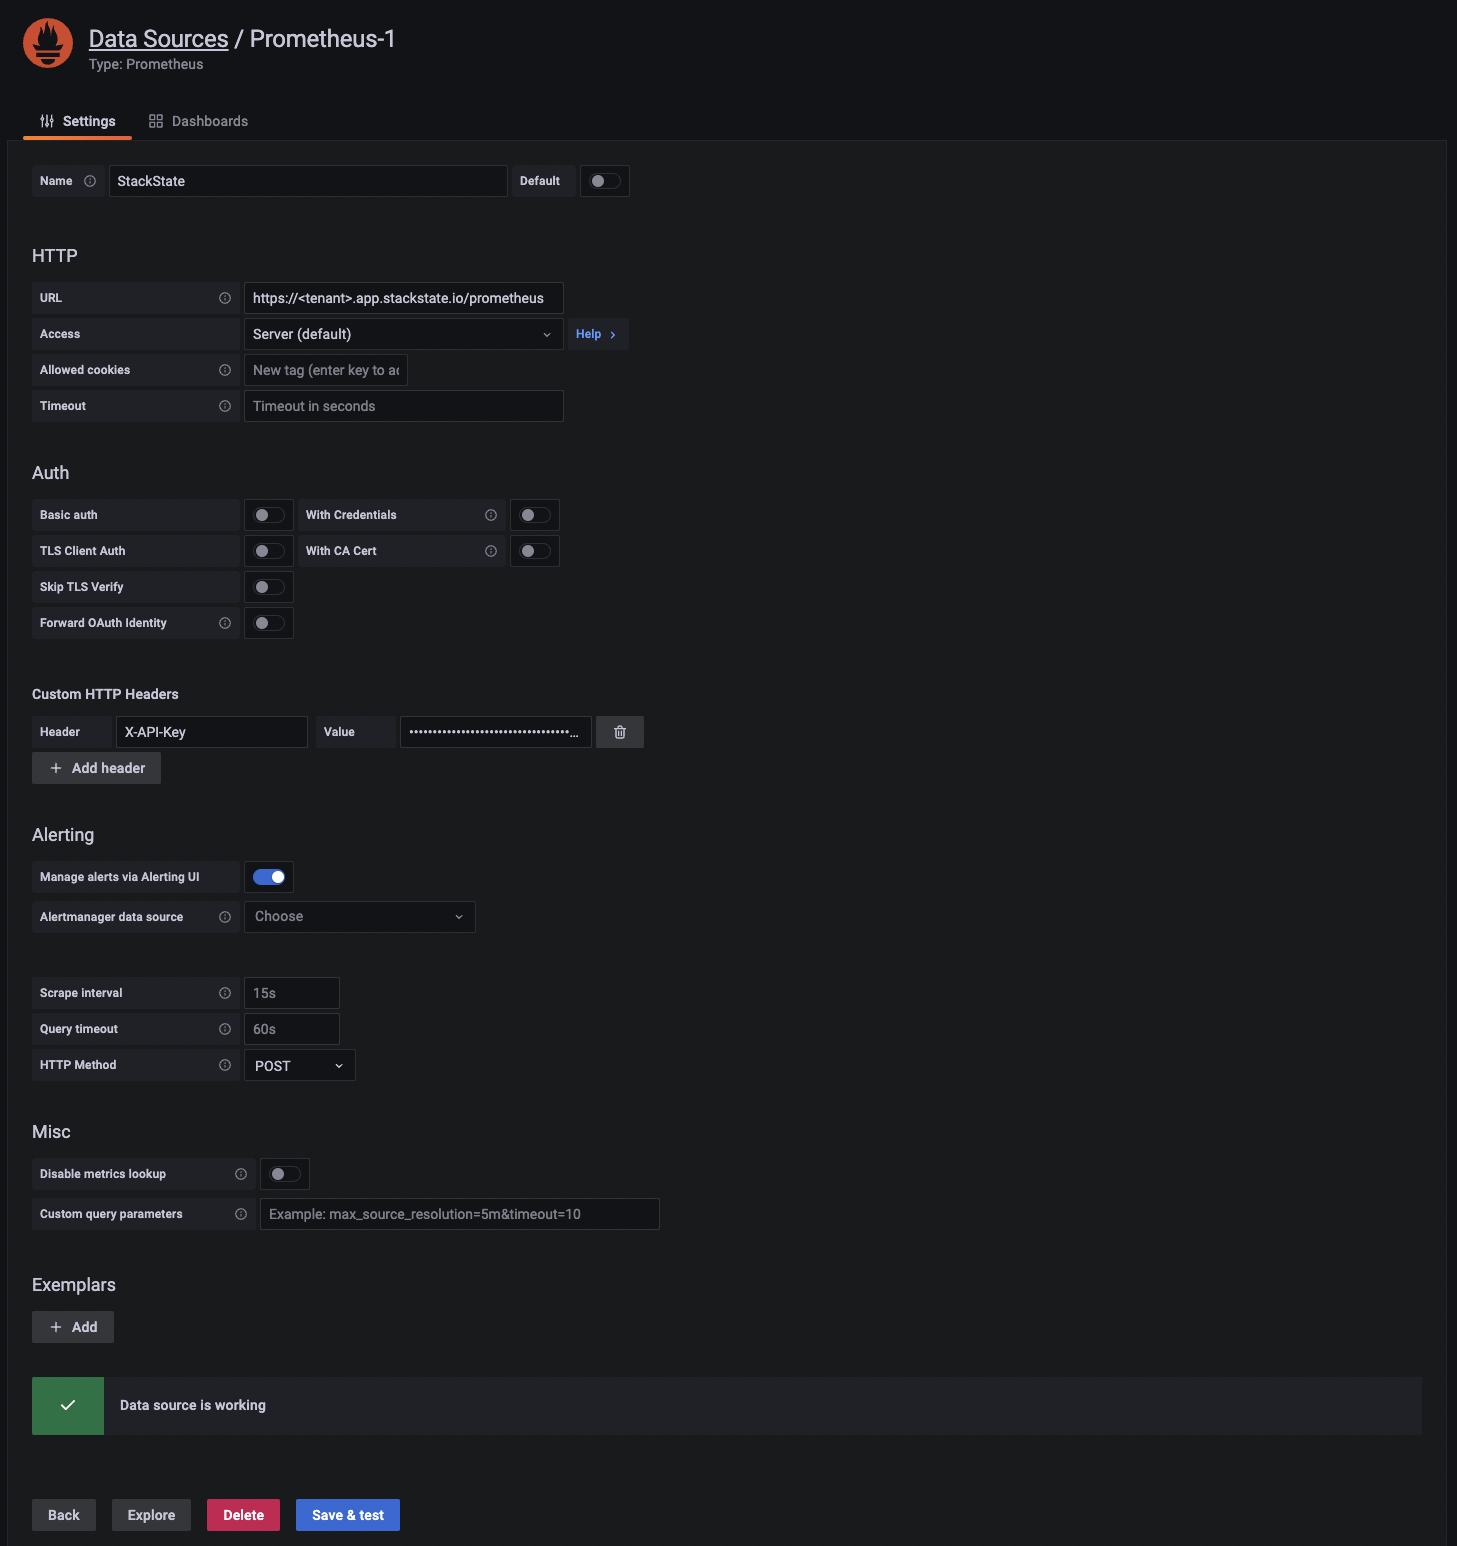
Click on the Save & Test button to save the datasource. If the configuration is correct, you should see a green Data source is working message.
Restrict access to metrics
When you use Rancher RBAC, it is possible to grant access to metrics on a cluster or namespace level.
To grant access to all metrics from a cluster:
> sts rbac grant --subject grafana --permission get-metrics --resource k8s:YOUR_CLUSTER:__any__
✅ Granted permission 'get-metrics' on 'k8s:YOUR_CLUSTER:__any__' to subject 'grafana'
PERMISSION  | RESOURCE
get-metrics | k8s:YOUR_CLUSTER:__any__
To grant access to all metrics from a namespace:
> sts rbac grant --subject grafana --permission get-metrics --resource k8s:OTHER_CLUSTER:SINGLE_NAMESPACE
✅ Granted permission 'get-metrics' on 'k8s:OTHER_CLUSTER:SINGLE_NAMESPACE' to subject 'grafana'
PERMISSION  | RESOURCE
get-metrics | k8s:OTHER_CLUSTER:SINGLE_NAMESPACE
Inspect all permissions that have been granted to the subject:
> sts rbac describe-permissions --subject grafana
PERMISSION  | RESOURCE
get-metrics | k8s:OTHER_CLUSTER:YOUR_NAMESPACE
get-metrics | k8s:YOUR_CLUSTER:__any__